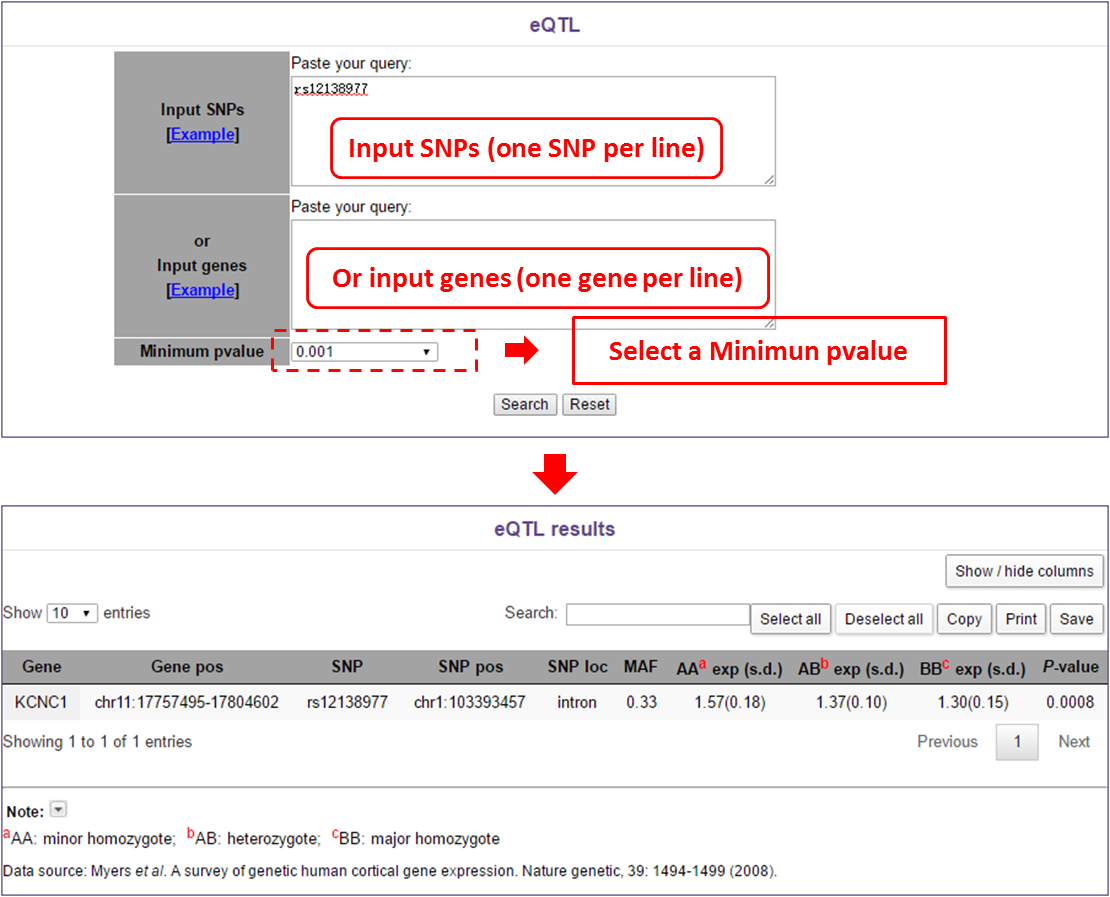
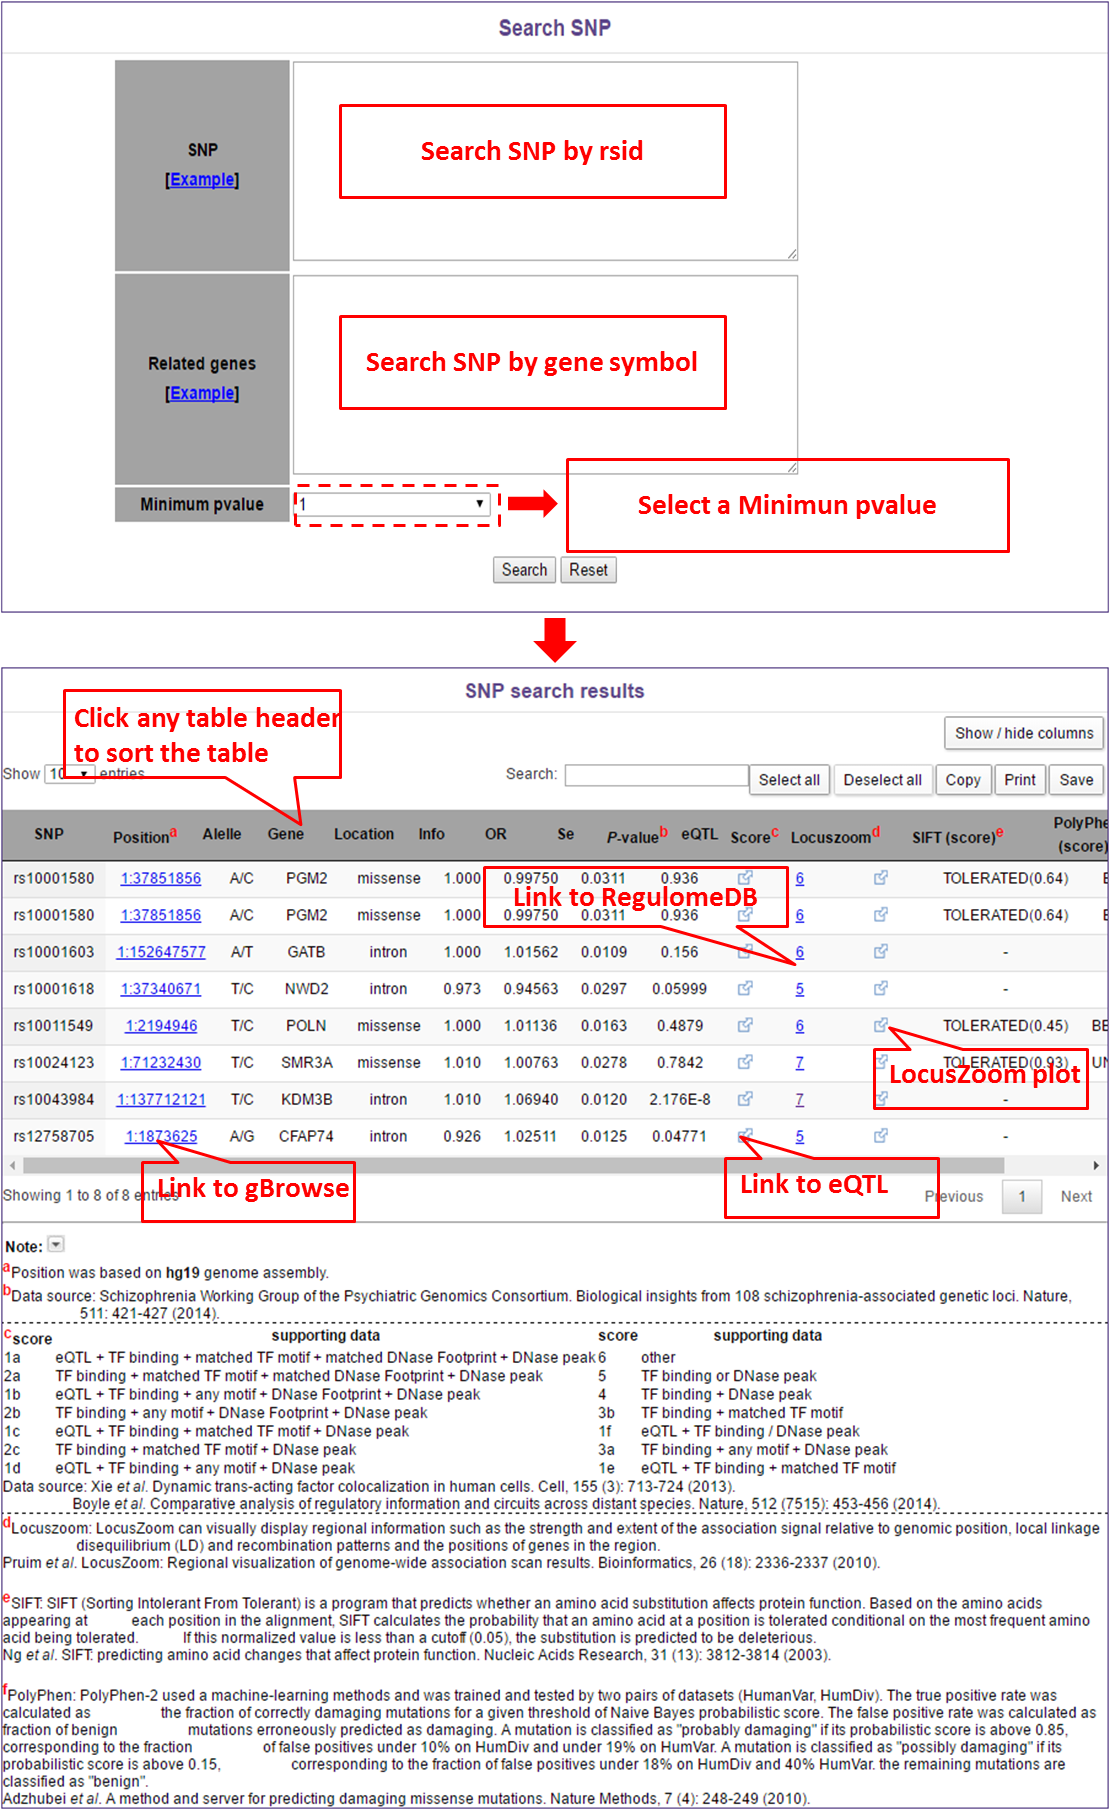
In this module, users can search SNP by rsid, gene symbol and select a Minimum P-value of a SNP. For example, if users input some SNPs (one SNP per line) and clik "search" button, they will get the results by rsid. But if users input some genes (also one gene per line), they will get results of those SNPs in input genes. Last, if users also select a minimum P-value, they will get the results with P-value less than they select.
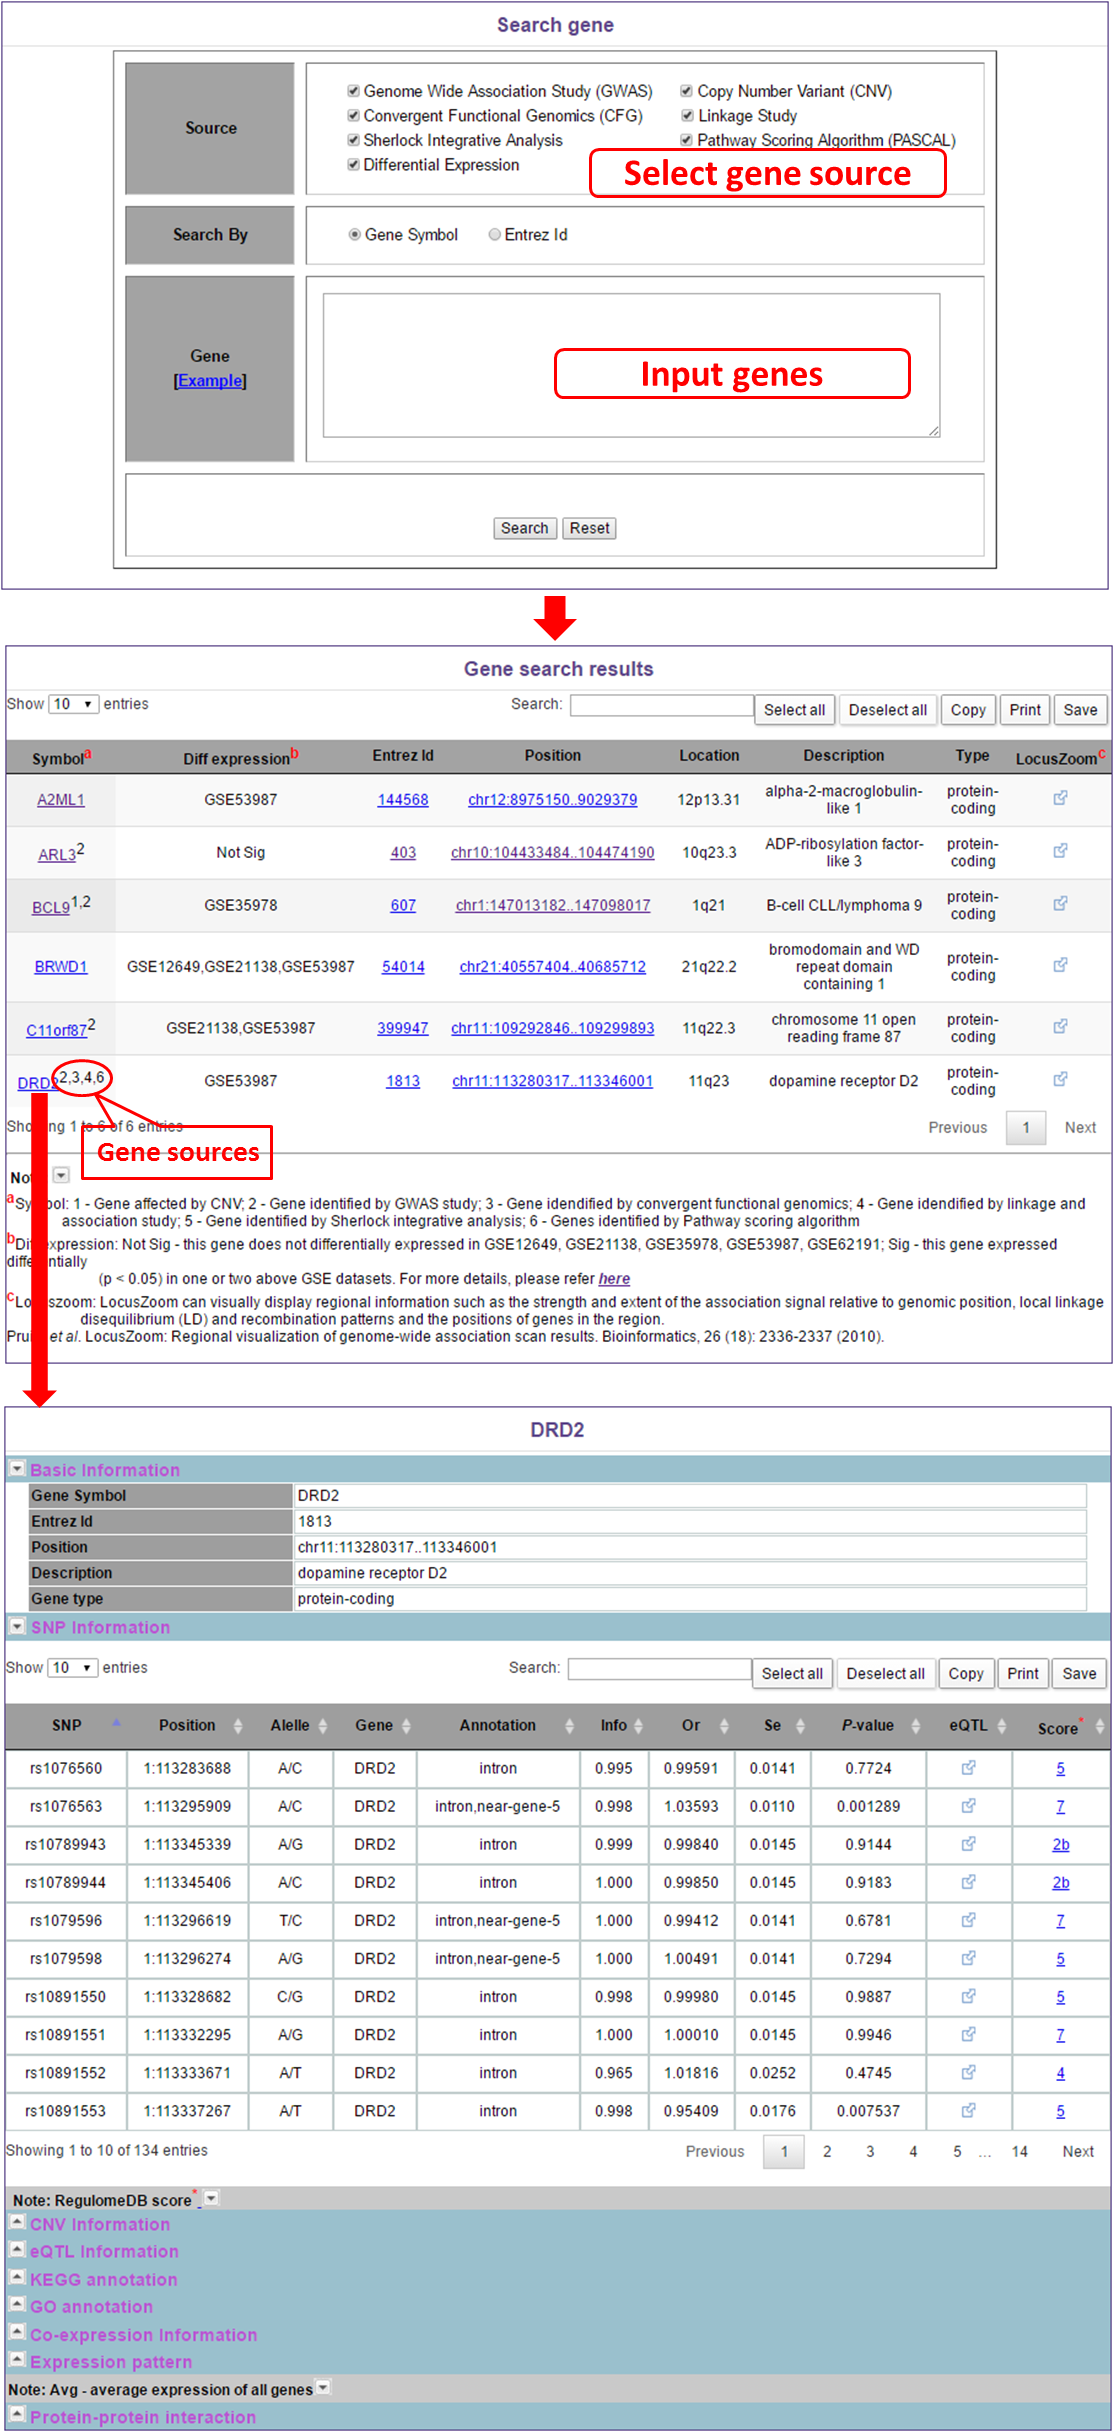
In this module, users can search gene by the sourceof gene, gene symbol or Entrez Id. For example, if users select one or more gene sources and click "search" button, they will get gene results with they select gene sources. Users can also search genes by inputing their interested genes and select interested gene sources.
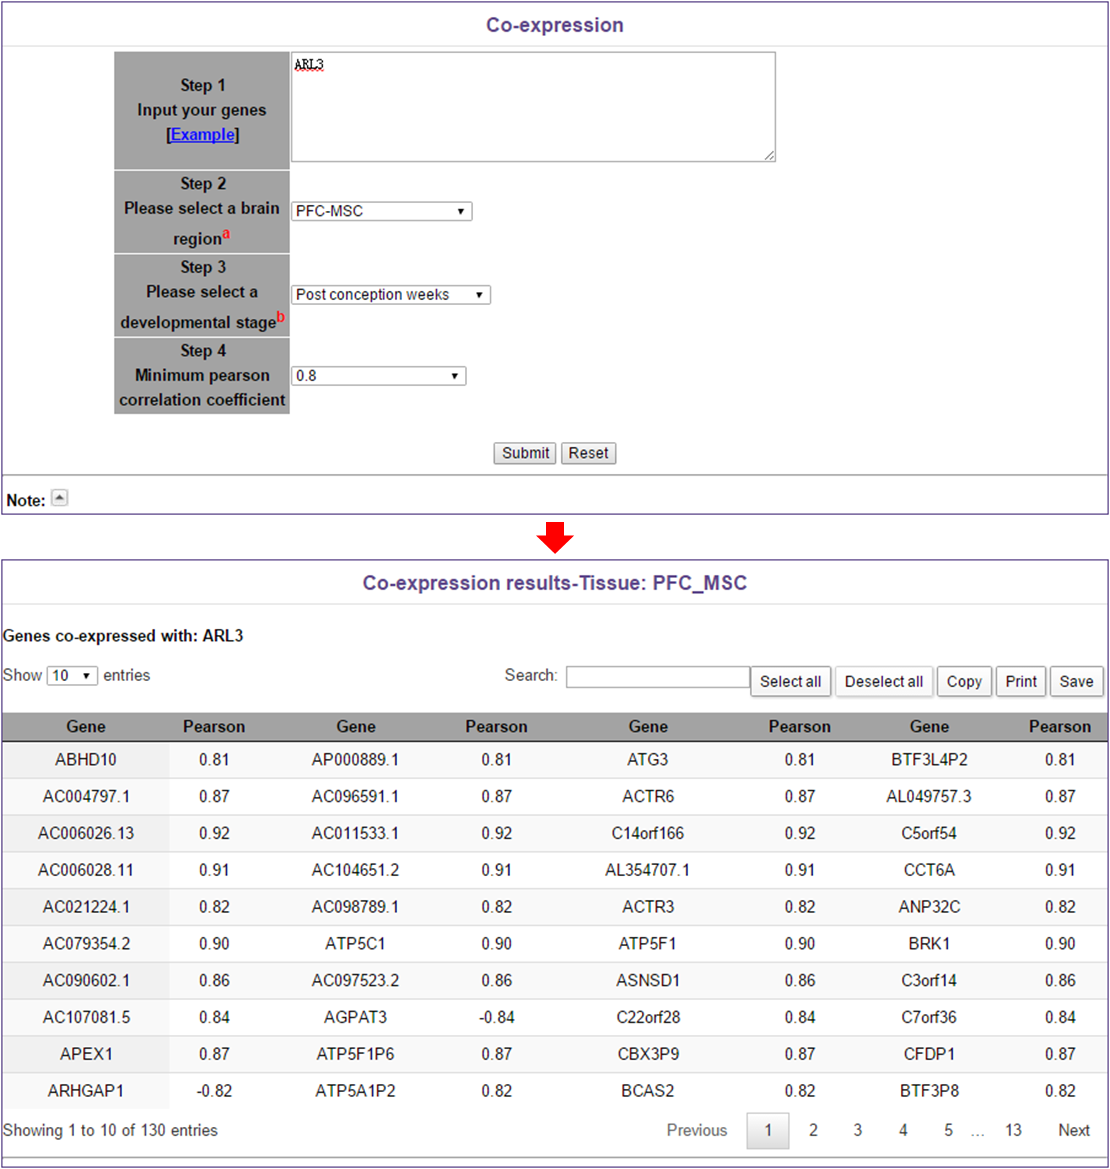
In this module, users need to do the following 4 steps: 1. Input genes (one gene per line); 2. Select a brain region; 3. Select a developmental stage; 4. Select a minimum P-value.
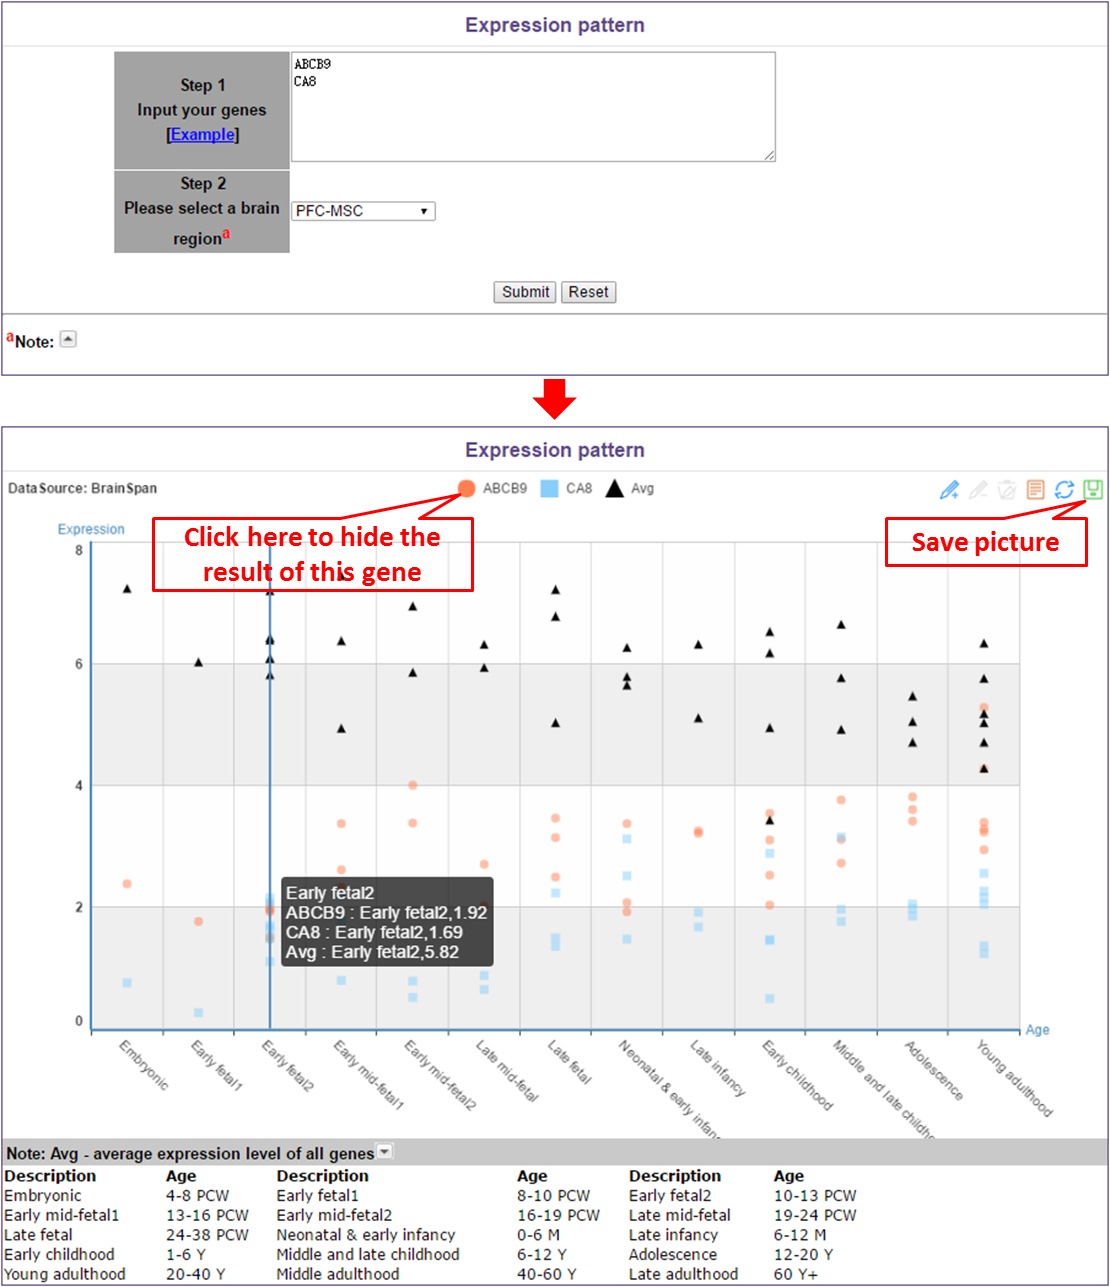
In this module, users need to do the following 2 steps: 1. Input genes (one gene per line); 2. Select a brain region.
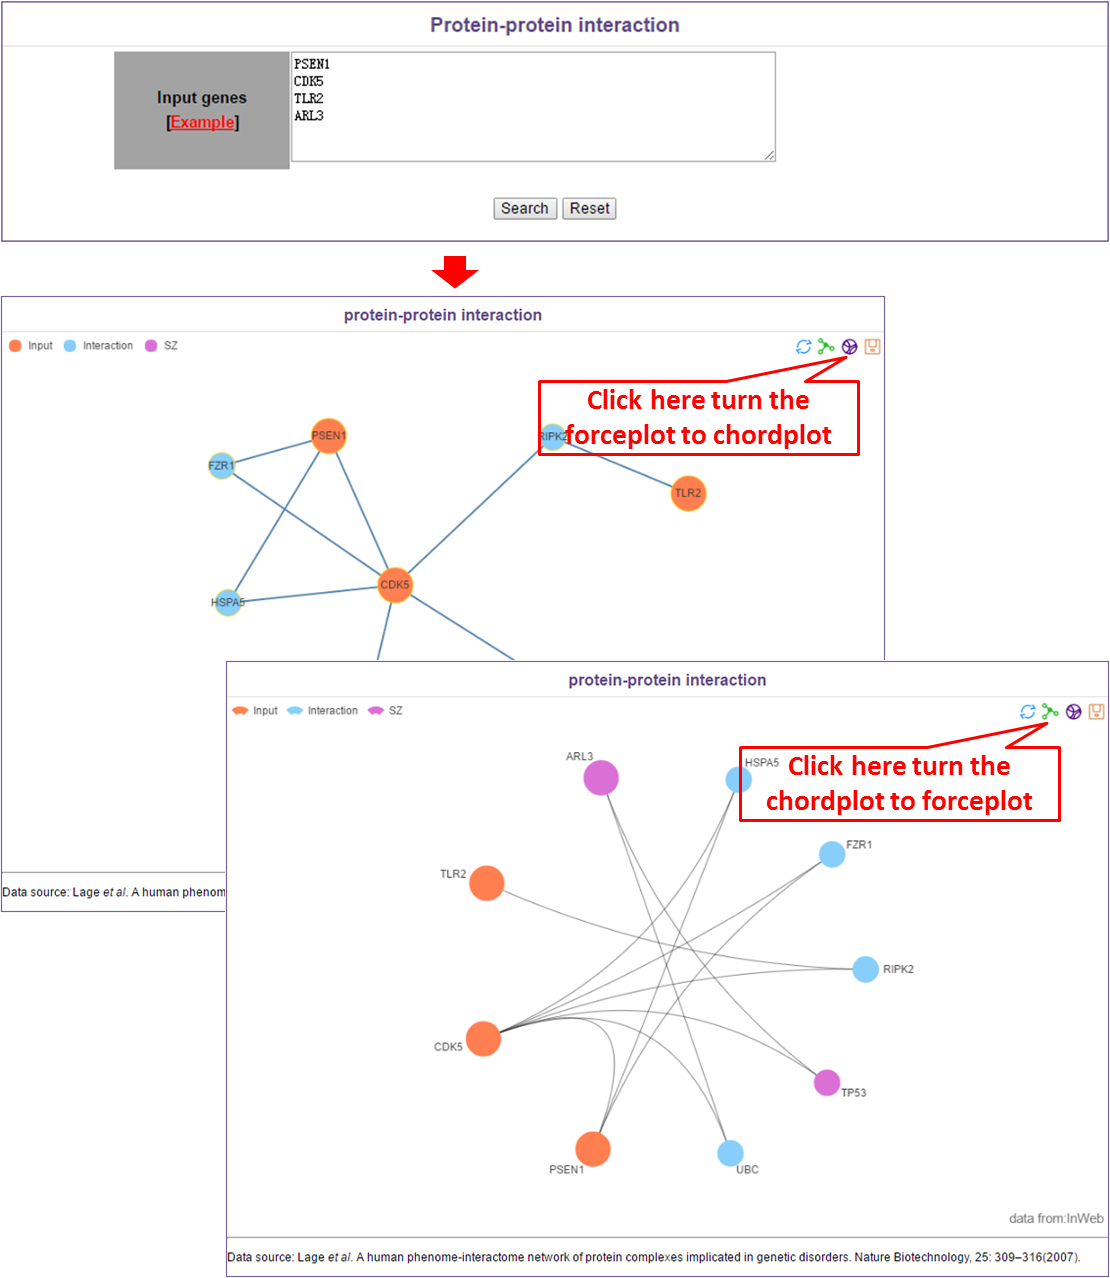
In this module, users only need to input interested genes (one gene per line).
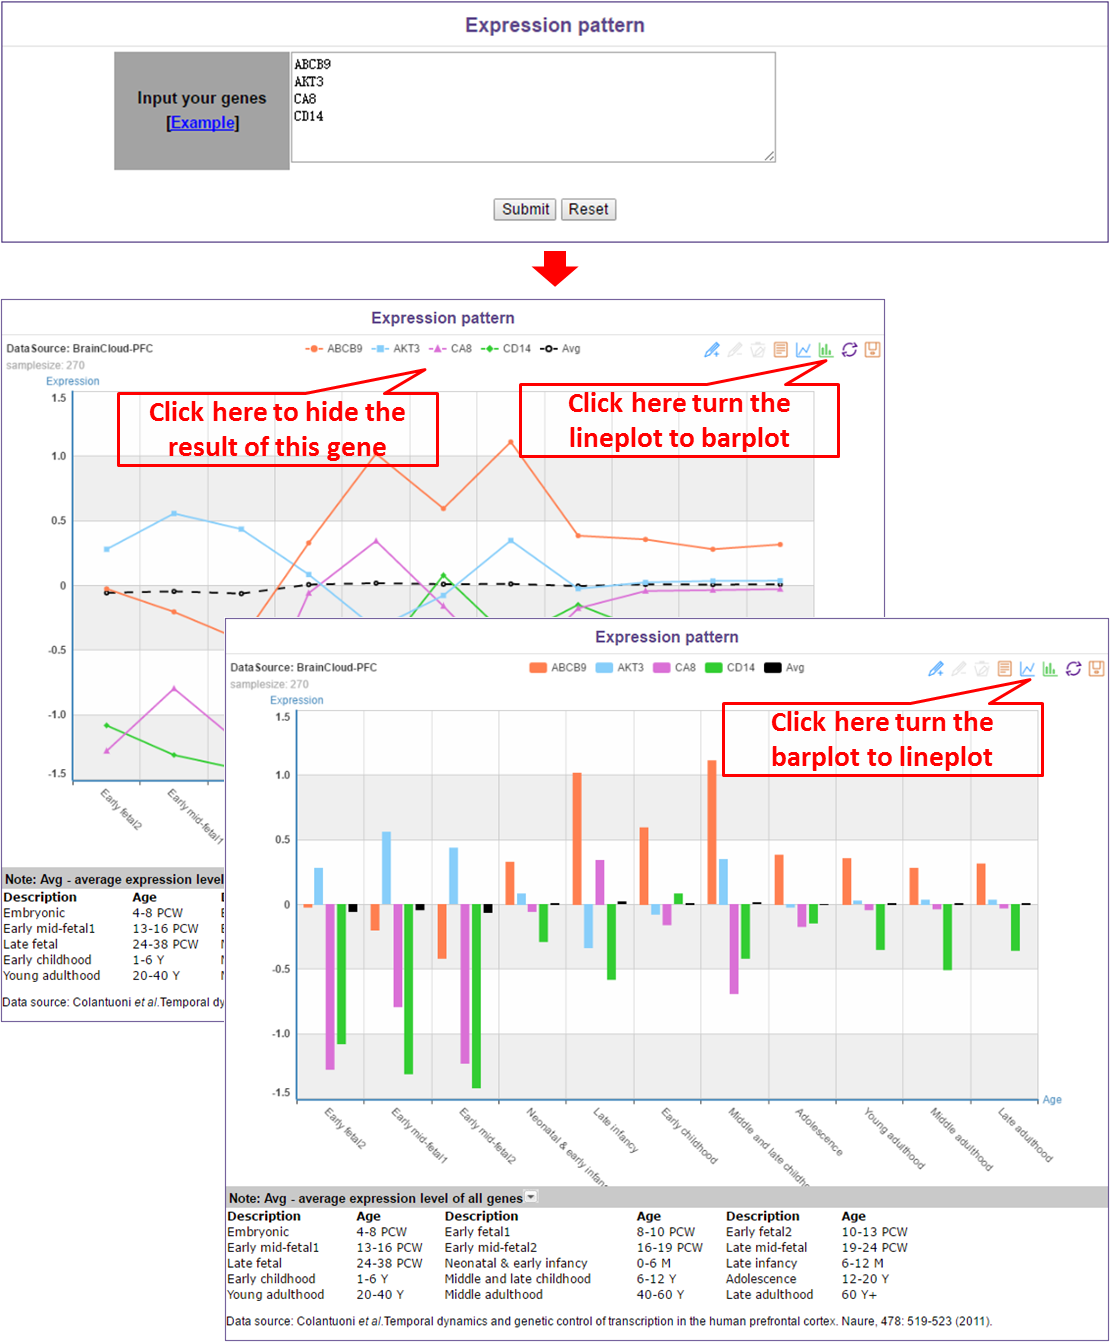
In this module, users only need to input interested genes (one gene per line).
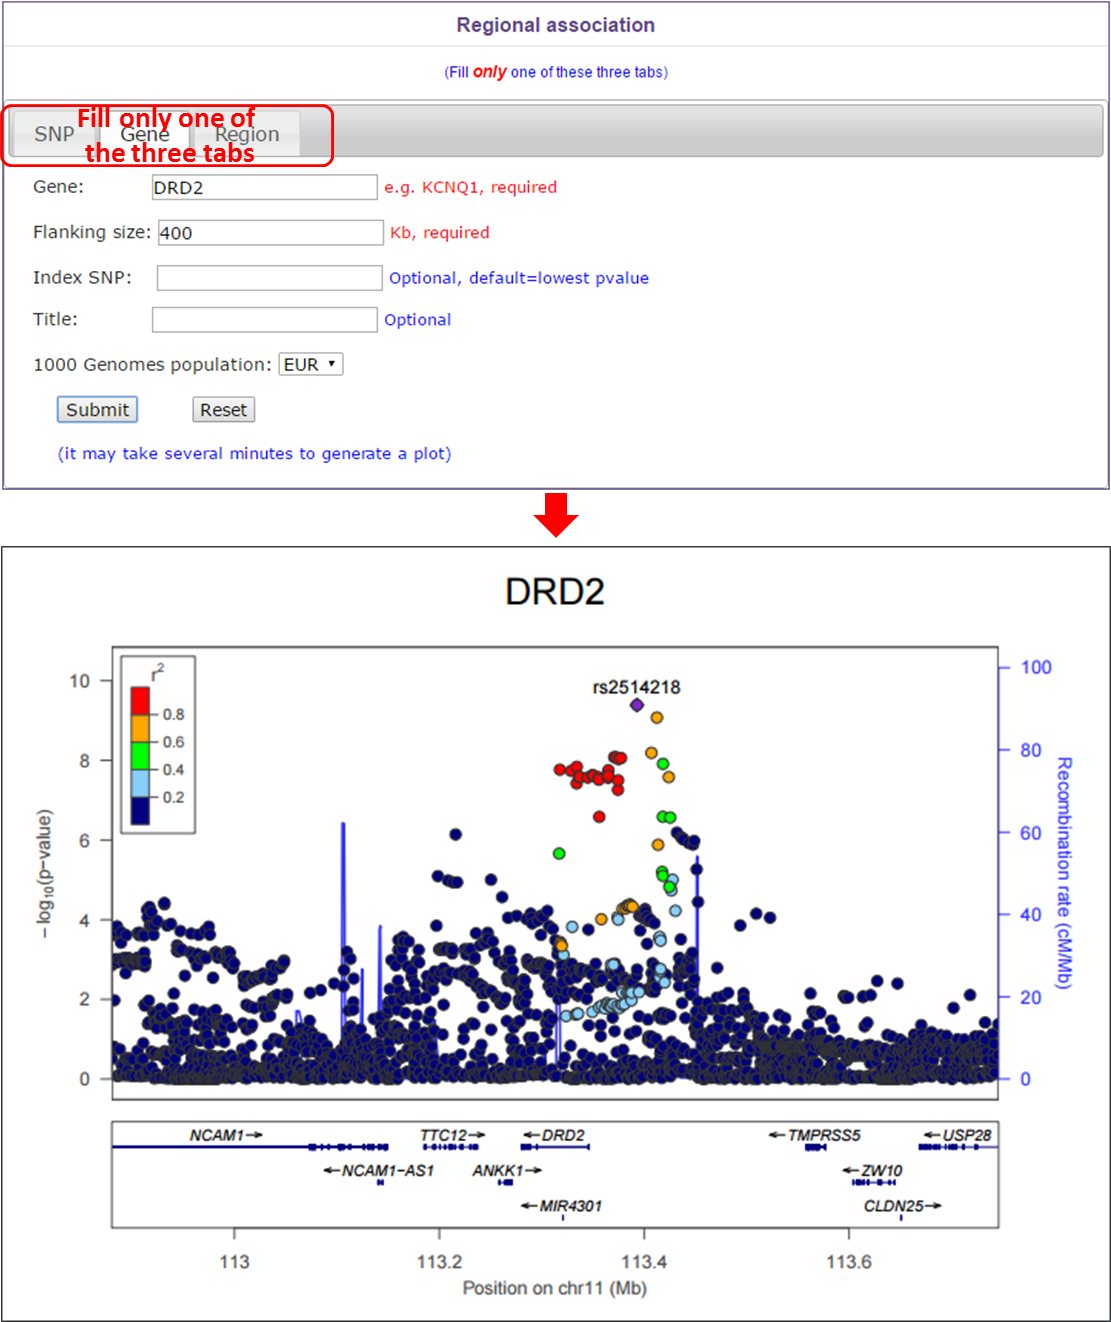
In this module, users can select different mode to generate a regional association plot. If users select SNP tab, they should supply a rsid, a flanking size and select a 1000 Genomes population. If users select gene tab, they should supply a gene name, a flanking size and select a 1000 Genomes population. Index SNP and title is optional. If users select region tab, they should select a chromosome, input start position, end position and select a 1000 Genomes population. Index SNP and title is optional.
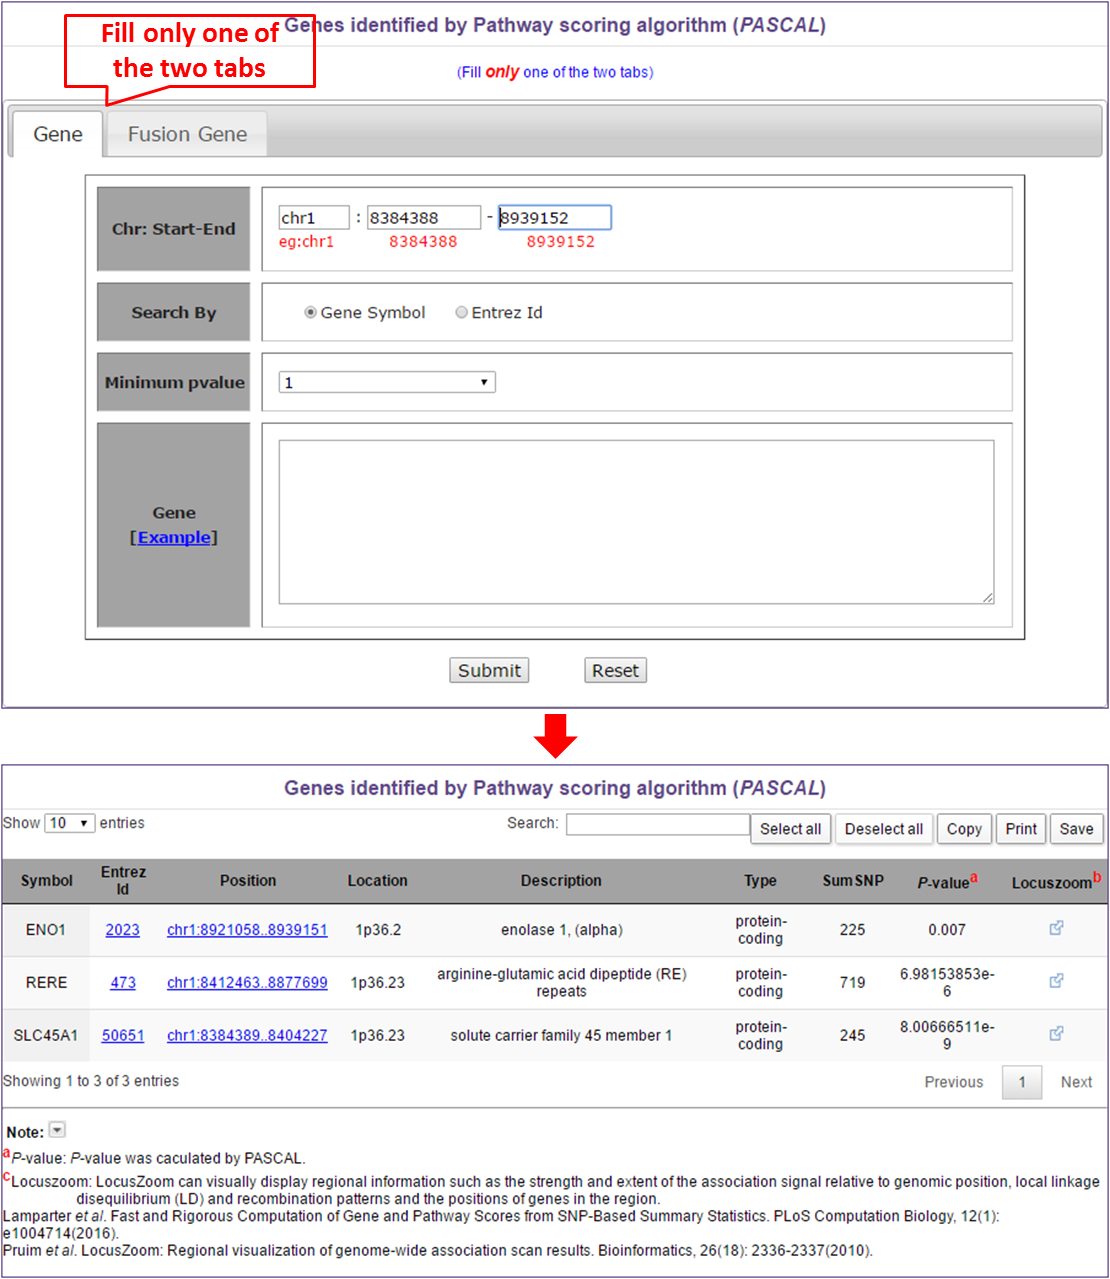
Like regional association study, user can select two modes to search pascal genes. If users select Gene tab, they can input position or minimum P-value or gene names (one gene per line). The input options also suit for the Fusion Gene tab.
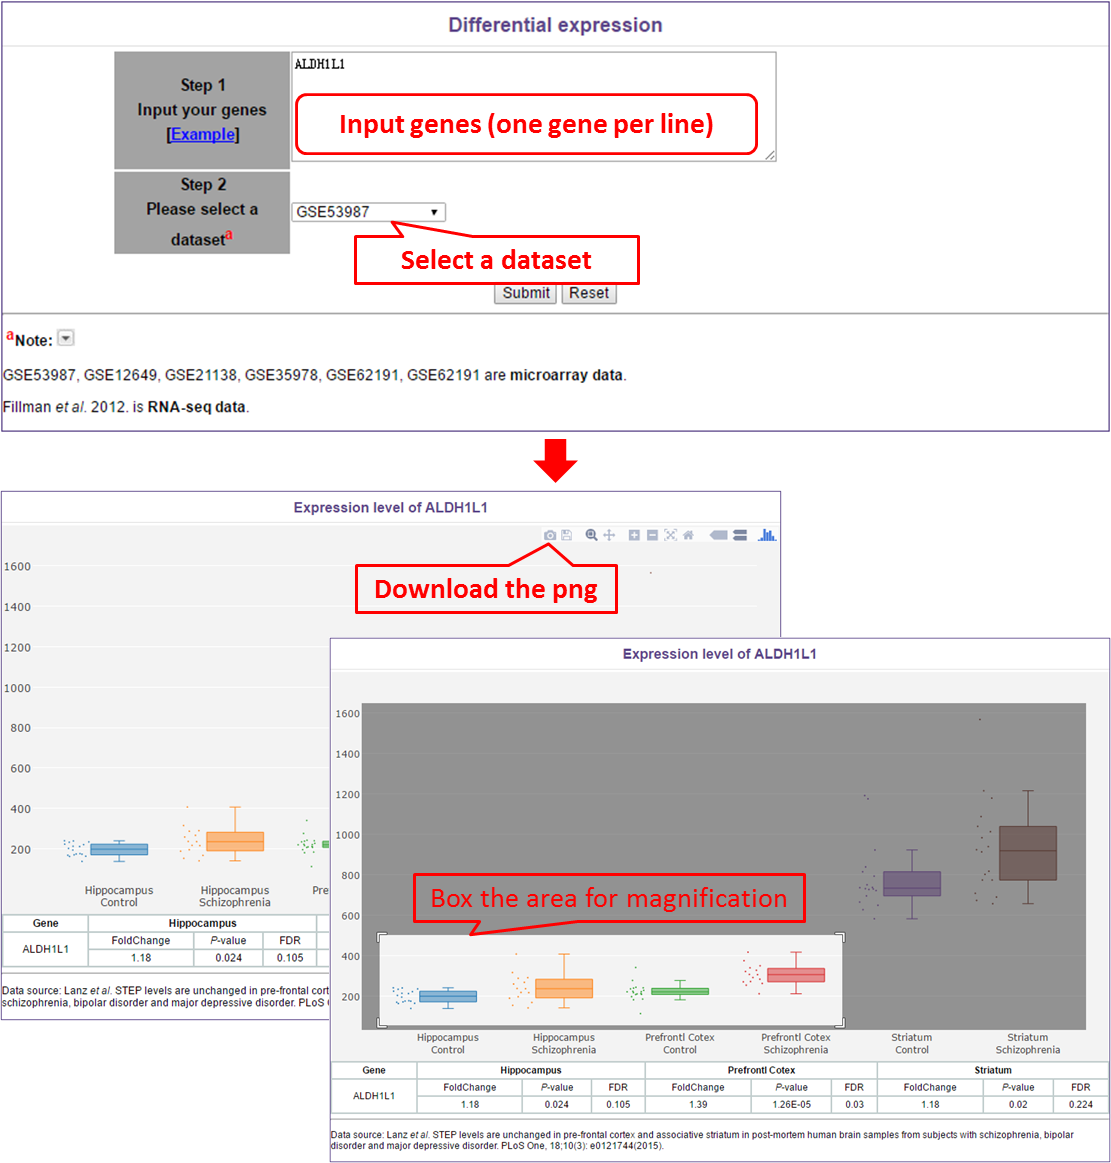
In this module, users need to do the following two things, input genes (one gene per line) and select a dataset. In the results page, users can download the boxplot or box the wanted area for magnification.
Citation: Yong Wu, Yong-Gang Yao and Xiong-Jian Luo. SZDB: A Database for Schizophrenia Genetic Research. Schizophrenia Bulletin (2017) 43 (2): 459-471.
Copyright © 2015-2017 Kunming Institute of Zoology, Chinese Academy of Sciences. All Rights Reserved.